यह लेख अभी हिन्दी में उपलब्ध नहीं है। आप मूल अंग्रेज़ी संस्करण पढ़ रहे हैं।
Demographics of Chitradurga District
Demographics of Chitradurga District
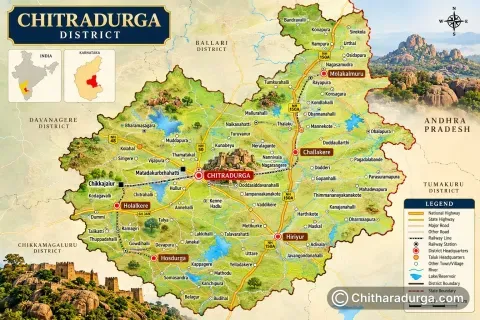
Chitradurga District has a diverse population shaped by its long history, predominantly rural economy, agricultural traditions, border-region cultural influences and steadily developing urban centres. Spread across six taluks — Chitradurga, Challakere, Hiriyur, Holalkere, Hosadurga and Molakalmuru — the district brings together communities with different occupations, traditions, languages and ways of life.
While Kannada is the principal and most widely spoken language, the presence of Telugu, Urdu, Lambadi and other languages reflects the district's social and cultural diversity. Chitradurga continues to have a predominantly rural population, although towns such as Chitradurga, Challakere and Hiriyur have emerged as important centres of administration, education, commerce and services.
Note: Population figures in this article are based on the Census of India 2011, the latest completed official Census dataset available for detailed district-level demographic statistics.
Population of Chitradurga District
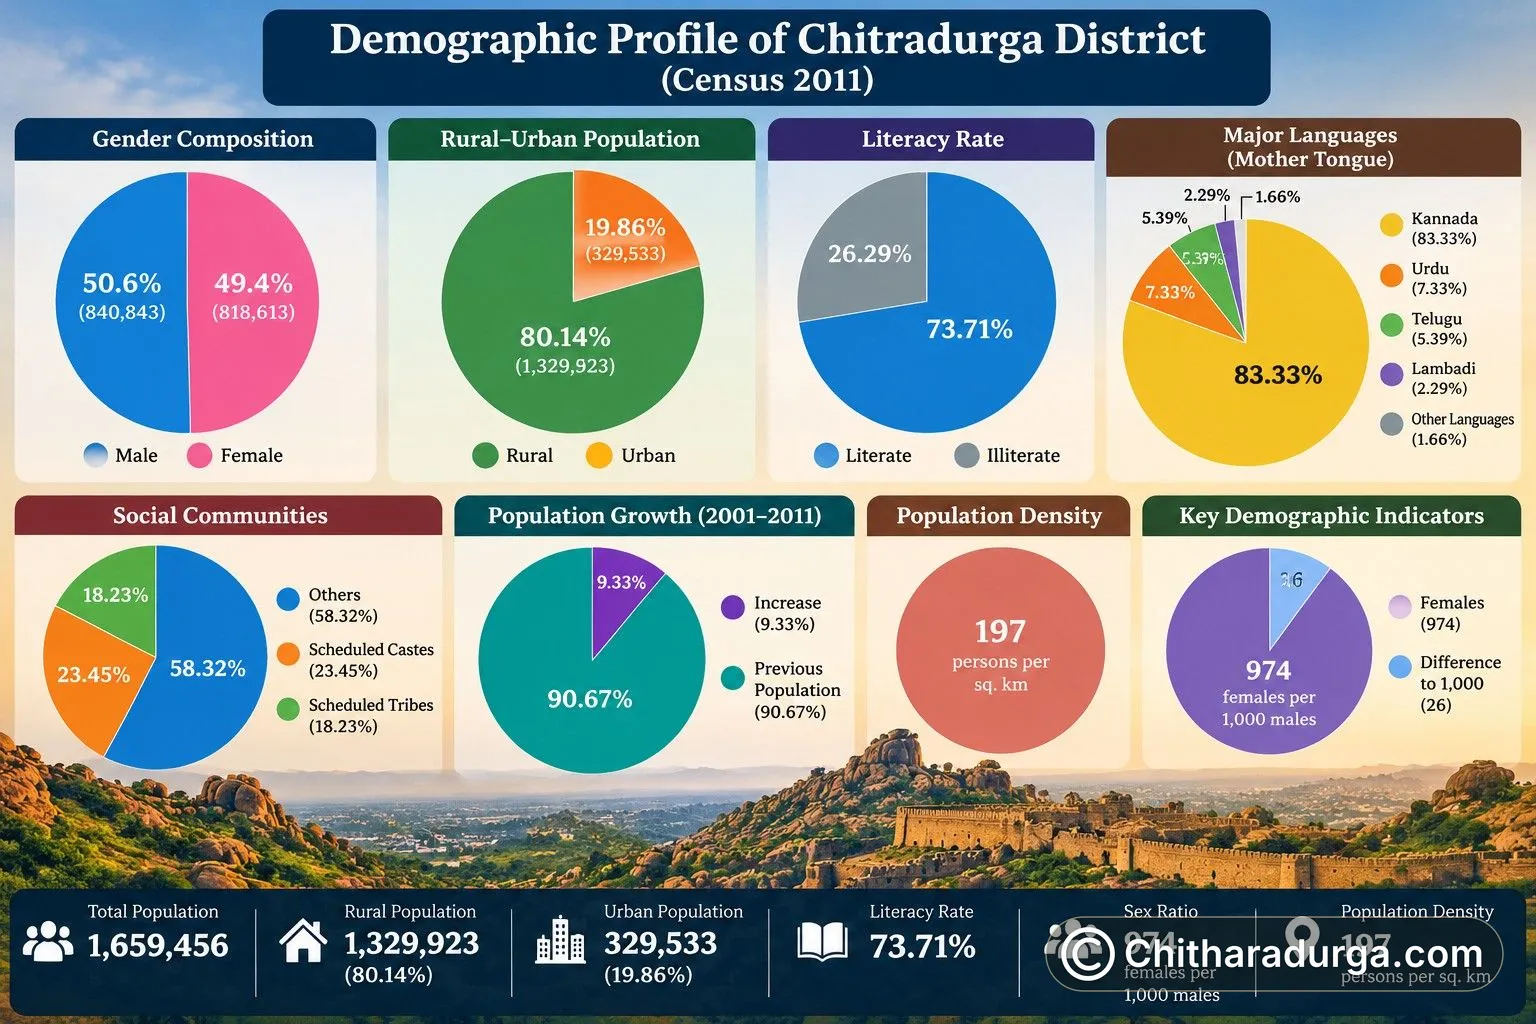
According to the 2011 Census of India, Chitradurga District had a total population of 1,659,456 (16.59 lakh). Of this, 840,843 were males and 818,613 were females.
The district recorded a population increase of about 9.33% between 2001 and 2011, rising from 1,517,896 in 2001 to 1,659,456 in 2011.
Population at a Glance
Demographic Indicator | Census 2011 |
|---|---|
Total Population | 1,659,456 |
Male Population | 840,843 |
Female Population | 818,613 |
Rural Population | 1,329,923 |
Urban Population | 329,533 |
Rural Population Share | 80.14% |
Urban Population Share | 19.86% |
Population Density | 197 persons per sq. km |
Decadal Population Growth (2001–2011) | 9.33% |
Sex Ratio | 974 females per 1,000 males |
Literacy Rate | 73.71% |
The district's population density stood at approximately 197 persons per square kilometre. The overall sex ratio was 974 females for every 1,000 males. Literacy reached 73.71%, reflecting a considerable improvement from 64.45% recorded in 2001.
The male literacy rate was approximately 81.37%, while female literacy stood at approximately 65.88%.
Rural and Urban Population
One of the defining characteristics of Chitradurga's demography is its strong rural character.
Of the district's total population of 1.659 million in 2011, approximately 1.330 million people lived in rural areas, while about 329,533 people lived in urban areas.
Area | Population | Share of District Population |
|---|---|---|
Rural Chitradurga | 1,329,923 | 80.14% |
Urban Chitradurga | 329,533 | 19.86% |
Total | 1,659,456 | 100% |
This means roughly four out of every five residents of Chitradurga District lived in rural areas at the time of the 2011 Census.
The rural population increased by about 6.94% between 2001 and 2011, whereas the urban population grew by approximately 20.16% during the same decade. This indicates that although Chitradurga remained predominantly rural, its urban centres were expanding at a considerably faster rate.
Rural Chitradurga
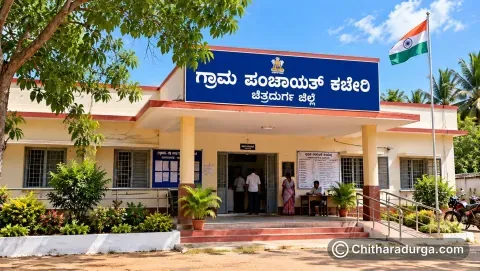
The rural population is distributed across hundreds of villages under the district's Gram Panchayat system. The present district administrative profile lists 1,063 villages and 189 Gram Panchayats across the six taluks.
Agriculture and allied activities have traditionally formed an important part of rural life. Farming, livestock rearing, agricultural labour, small businesses, traditional occupations, weaving and other local economic activities contribute to village livelihoods.
The rural character varies across the district. Challakere and Molakalmuru include extensive dry and semi-arid landscapes, while Hiriyur is strongly associated with the Vani Vilasa Sagara region and agriculture. Holalkere and Hosadurga have their own combinations of agricultural settlements, hills and village communities, while rural Chitradurga Taluk surrounds the rapidly developing district headquarters.
Gram Panchayats form the grassroots level of local government in these areas, linking villages with Taluk Panchayats, the Zilla Panchayat and government departments.
Urban Chitradurga
Urbanisation is concentrated mainly around the district's major towns and administrative centres.
Chitradurga city is the largest urban centre and the district headquarters. It serves as the principal centre for district administration, education, healthcare, commerce, transport and other services.
Challakere has developed into another important urban and commercial centre. In addition to its traditional agricultural and trading economy, the wider Challakere region has gained prominence because of major scientific, research and strategic establishments.
Hiriyur is an important commercial and transportation centre, supported by its location on a major highway corridor and the agricultural economy of the surrounding region.
Hosadurga, Holalkere and Molakalmuru also function as important local service and commercial centres for their surrounding rural areas.
The 2011 Census recorded urban populations of 151,737 in Chitradurga Taluk, 56,416 in Hiriyur, 55,194 in Challakere, 28,370 in Hosadurga, 22,019 in Holalkere and 15,797 in Molakalmuru.
Languages of Chitradurga District
Chitradurga is linguistically diverse, although Kannada is overwhelmingly the principal language of the district.
According to Census 2011 mother-tongue data, approximately 83.33% of the district population reported Kannada as their mother tongue. Other significant languages included Urdu, Telugu and Lambadi. Census language tables provide mother-tongue information separately at district, rural and urban levels.
Major Mother Tongues
Language | Approx. Share of Population |
|---|---|
Kannada | 83.33% |
Urdu | 7.33% |
Telugu | 5.39% |
Lambadi | 2.29% |
Other Languages | About 1.66% |
Kannada
Kannada is the dominant language of administration, education, literature, media, cultural activities and everyday communication throughout most of Chitradurga District.
The district has a rich Kannada cultural and literary heritage. Its history, folklore, folk songs, oral traditions and stories connected with the Nayaka rulers, Madakari Nayaka, Onake Obavva and numerous local legends have contributed to the cultural identity of the region.
Telugu
Telugu has a noticeable presence, particularly in parts of the district closer to the Karnataka–Andhra Pradesh cultural zone.
The influence is especially visible in parts of Molakalmuru and Challakere taluks, where generations of interaction, migration, trade and geographical proximity have created areas with Kannada-Telugu linguistic connections.
Urdu
Urdu is another significant language spoken by sections of the district's population, particularly within Muslim communities and in several towns and settlements.
Lambadi
Lambadi, associated with Lambani/Banjara communities, forms another important part of Chitradurga's linguistic landscape. Lambani settlements and cultural traditions add distinctive elements of language, dress, embroidery, folk culture and social customs to the district.
The official Chitradurga District portal broadly lists Kannada, Telugu, Hindi and English among the languages spoken in the district.
Communities of Chitradurga
Chitradurga District is home to a wide range of social and cultural communities whose histories are closely connected with agriculture, pastoral life, trade, crafts, military traditions, religious institutions and village society.
The district includes communities belonging to Scheduled Castes, Scheduled Tribes, Other Backward Classes and numerous other social groups, alongside communities associated with different religious and occupational traditions.
According to the 2011 Census, the Scheduled Caste population constituted approximately 23.45% of the district population, making it a significant component of Chitradurga's demographic structure. The Scheduled Tribe population constituted approximately 18.23%.
Scheduled Castes and Scheduled Tribes
Community Category | Approx. Share of Population |
|---|---|
Scheduled Castes | 23.45% |
Scheduled Tribes | 18.23% |
The substantial Scheduled Caste and Scheduled Tribe population is an important feature of the district's demographic profile.
Among the communities historically associated with the wider Chitradurga region are Nayaka/Valmiki communities, while Lambani/Banjara communities are also part of the district's social and cultural landscape.
The district is also known for pastoral traditions, including communities historically associated with cattle and sheep rearing. The Kadu Golla cultural tradition, in particular, forms a distinctive part of the folk heritage of the Chitradurga region.
Alongside these are numerous agricultural, artisan, trading, weaving and service communities that have contributed to the district's economic and cultural development over generations.
A Predominantly Rural but Changing District
Chitradurga's demographic identity is best understood as a combination of deeply rooted village traditions and gradually expanding urban centres.
Its villages preserve agricultural practices, folk traditions, local festivals, oral histories, community institutions and traditional livelihoods. At the same time, Chitradurga city and other towns are expanding their roles in education, healthcare, commerce, technology, transportation and public administration.
The contrast is visible in the Census figures: in 2011, 80.14% of the population was rural and 19.86% urban, but the urban population had grown substantially faster during the preceding decade.
This gradual transition is shaping a district where traditional rural society continues to remain important while towns increasingly serve as centres of opportunity and economic activity.
Demographic Profile at a Glance
Category | Details |
|---|---|
Population | 1,659,456 |
Male Population | 840,843 |
Female Population | 818,613 |
Rural Population | 1,329,923 |
Urban Population | 329,533 |
Rural Share | 80.14% |
Urban Share | 19.86% |
Sex Ratio | 974 females per 1,000 males |
Population Density | 197 persons per sq. km |
Literacy Rate | 73.71% |
Major Language | Kannada |
Other Important Languages | Urdu, Telugu, Lambadi |
Scheduled Caste Population | Approx. 23.45% |
Scheduled Tribe Population | Approx. 18.23% |
Taluks | 6 |
Gram Panchayats | 189 |
Villages | 1,063 |
Diversity that Defines Chitradurga
The people of Chitradurga are an essential part of the district's identity. From farming villages and pastoral settlements to historic trading communities and expanding urban centres, generations of people have shaped the social and cultural character of the region.
Kannada remains the common linguistic and cultural foundation, while Telugu, Urdu, Lambadi and other linguistic traditions add to the district's diversity. Its many social communities, folk traditions, occupations, festivals and lifestyles together create a distinctive cultural landscape.
With more than 1.65 million people recorded in Census 2011, Chitradurga represents a district where history, rural traditions, cultural diversity and growing urbanisation come together, giving the region its unique demographic character.